Network Performance
In this lesson we'll learn
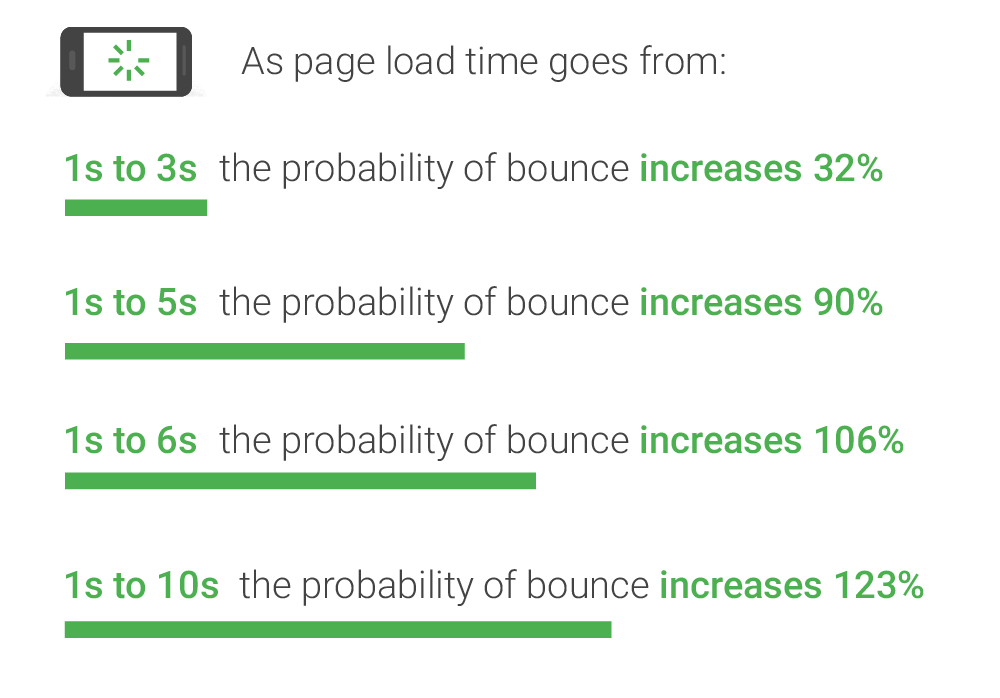
Interesting facts about page load time
Walmart and Amazon both observed a 1% increase in earnings for every 100 milliseconds of improved webpage speed.
Yahoo saw a 9% increase in traffic to every 400 milliseconds of webpage speed improvement.
Google loses 20% of their traffic for every additional 100 milliseconds it takes for a page to load.

In this lesson, we'll learn about
- Network terminology
- Filtering requests
- Inspecting packets
- Watching your app load with screenshots
- Simulate Network conditions
- Emulate offline mode
- The Network waterfall
The Network Waterfall
Let's talk about the life of a network request.
-
◻️ Queueing
- There are higher priority requests.
- There are already six TCP connections open for this origin, which is the limit. Applies to HTTP/1.0 and HTTP/1.1 only.
- The browser is briefly allocating space in the disk cache
-
⬜️ Stalled
- The request is stuck Queueing
-
🟩 DNS Lookup
- Resolving an IP address
-
🟧 Initial Connection
- TCP handshakes or establishing SSL
-
🟧 Service Worker Startup
- Starting up a Service Worker
-
🟪 Service Worker respondsWith
- Service Worker sending data to browser
-
🟩 Waiting (TTFB)
- Waiting for the first byte from the server
-
🟦 Content Download
- Browser is receiving a response from a server
Network performance isn't everything!
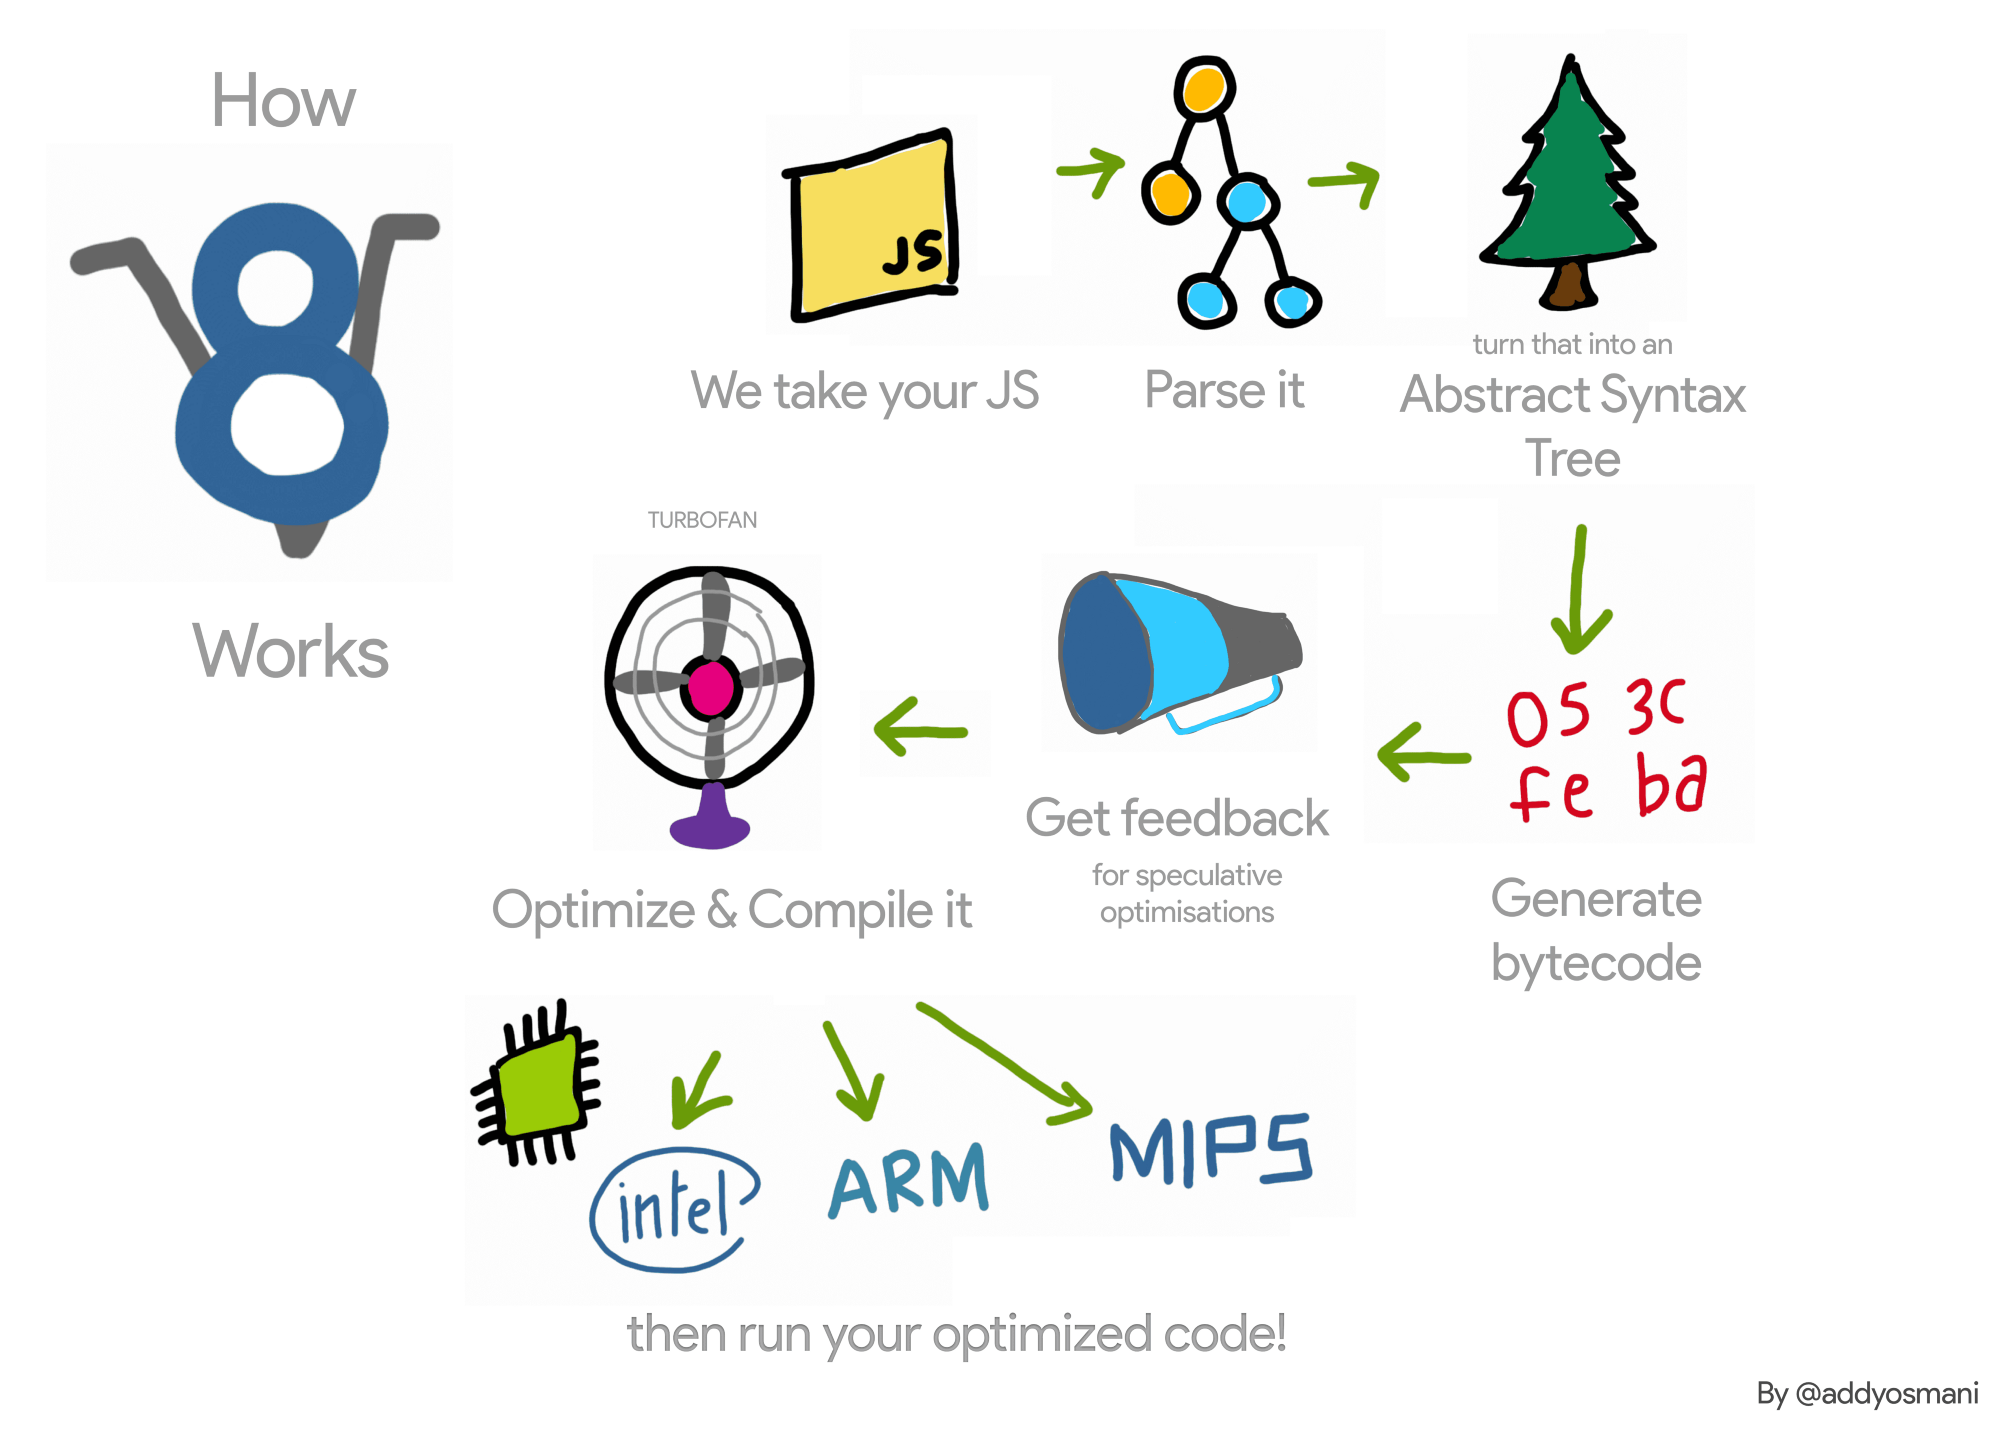
We spend so much energy compressing and combining JavaScript into dense bundles so they travel across the network faster! But that's not the whole story.
This entire article is worth a read but the TL;DR is that parse time is a huge performance problem, especially for mobile devices.


Measuring real user performance
Why measure performance from real users?
You can measure so many things using the performance API